Master 6 is the software to manage the archiving and the periodic calibration of the measuring instruments. It is compatible with 64 bit operating systems – Win 7 and Win 8.
It is supported by a database in MS SQL format.
The access to Master 6 is managed by a password and the operative permissions can be customizable for each user. The software is provided with a serie of instruments which make easier its use.


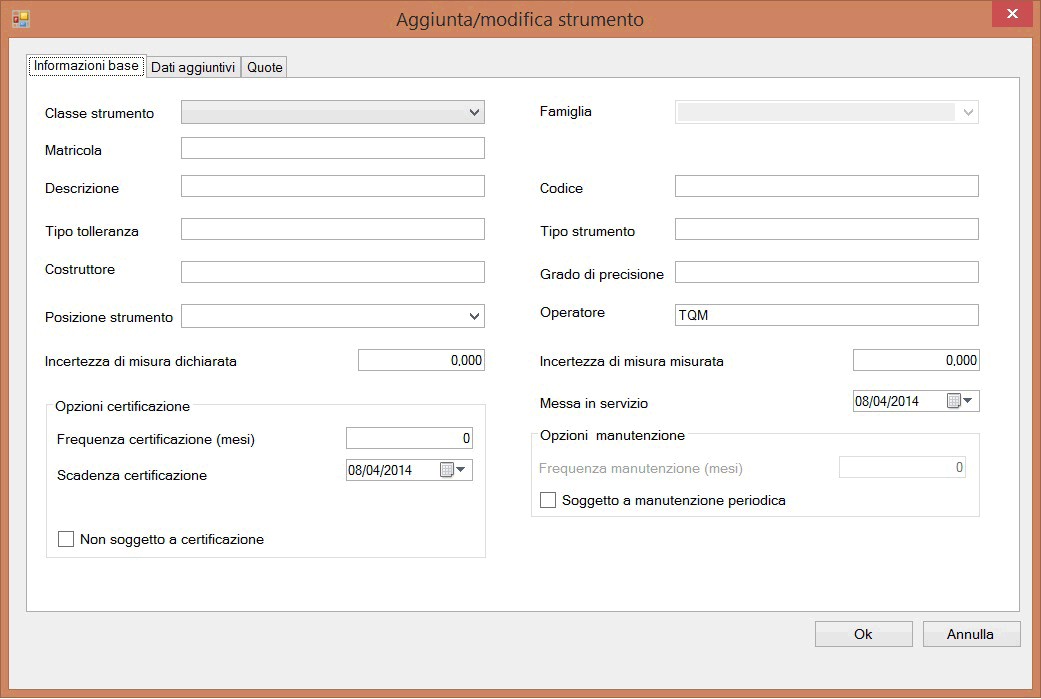
Each instrument has its own data sheet, where there are specified the quotas to be controlled.


Scheda strumento

It is possible to manage internal masters used for the certification of other instruments.

The external certifications are managed with the possibility to attach the external certificates.


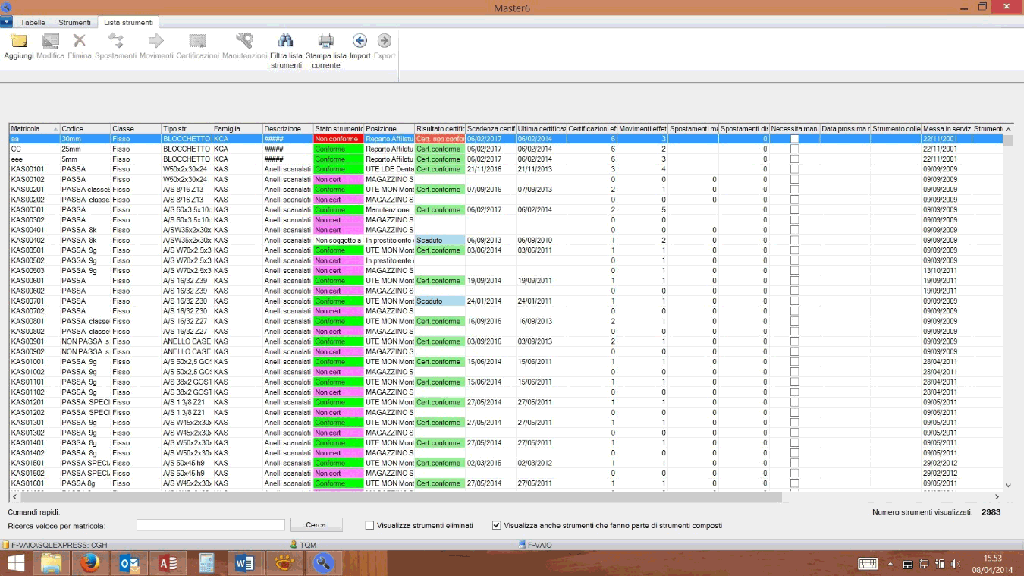
Lista strumenti

The global list underlines the status of the instrument with different colors. From the global list it’s possible to have access to all the available functions.


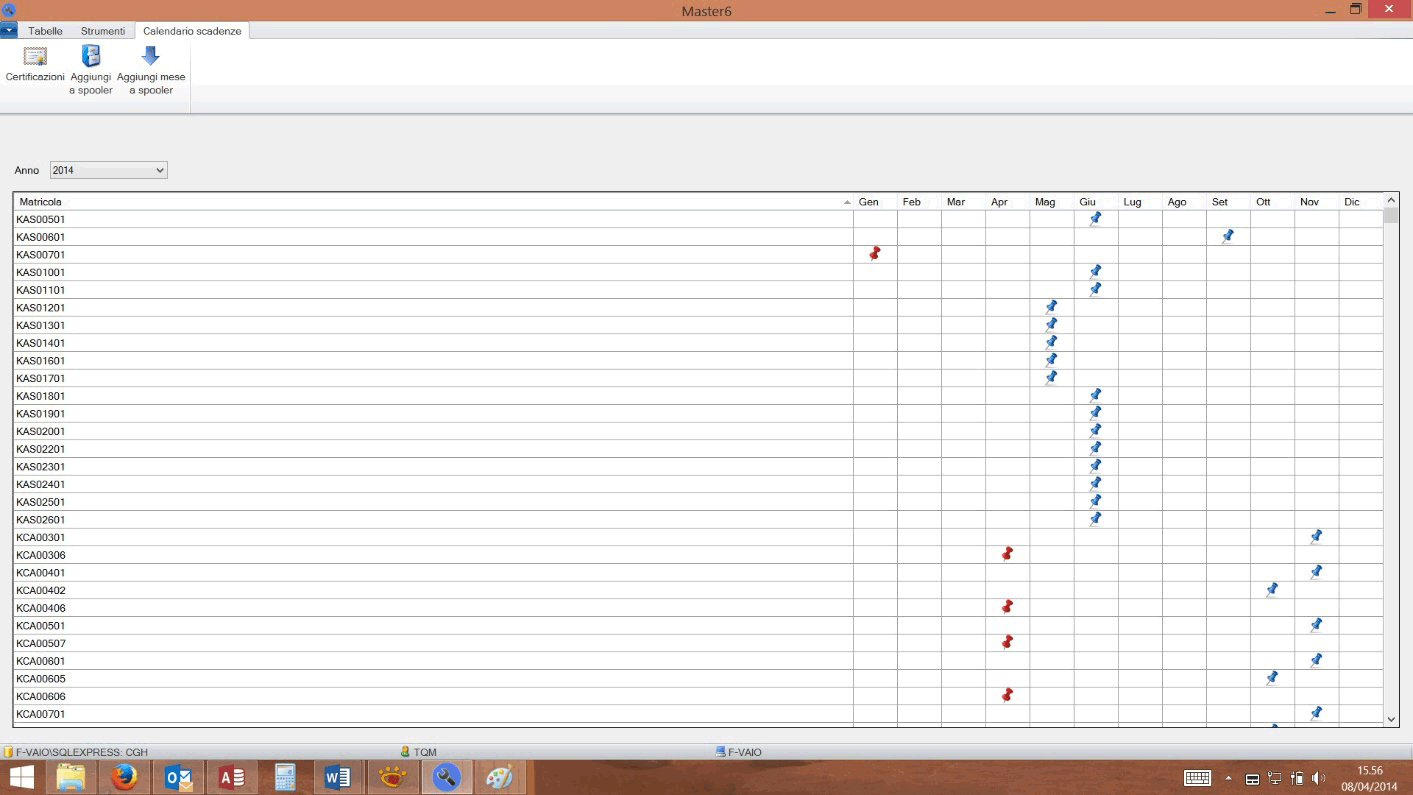
Scadenziario

It’s available the graphic timetable of the calibrations with the possibility to print the list of the expiring instruments or the list of already expired instruments, etc...


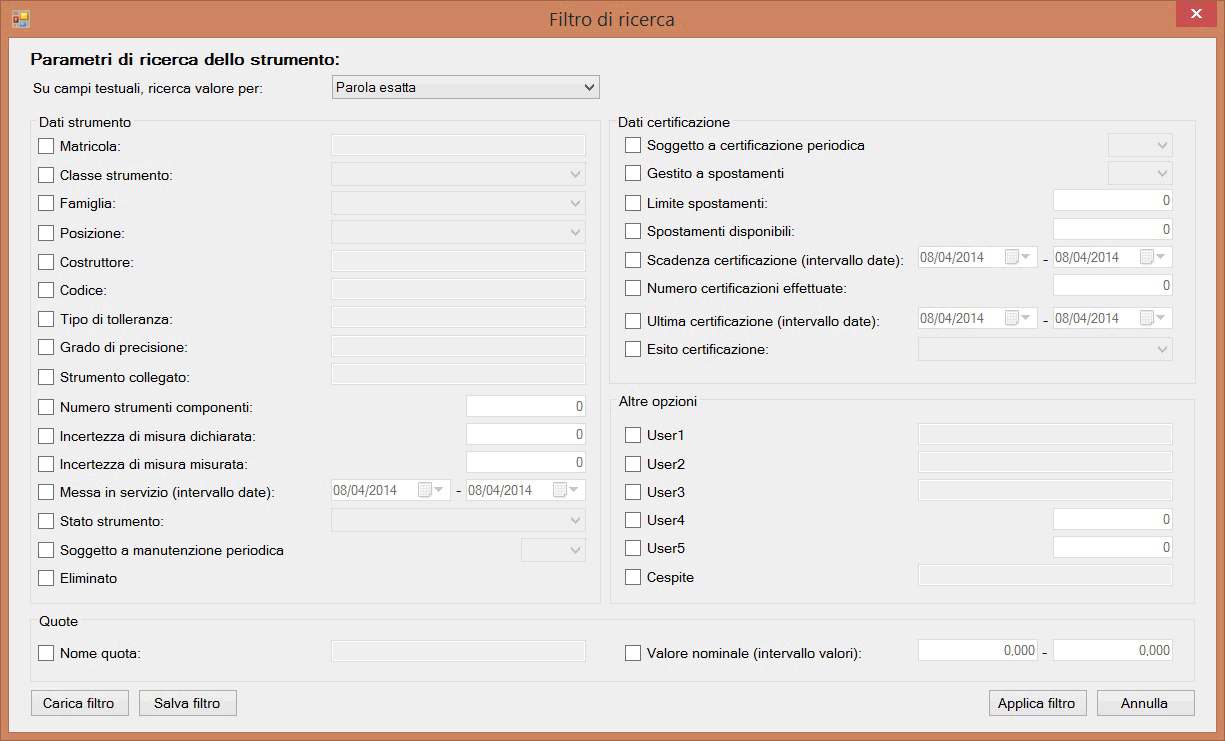
Filtri di ricerca

It is available a big range of filters, with possibility of printing the instruments list after the filters applications.


Different instruments for the Analysis are available:


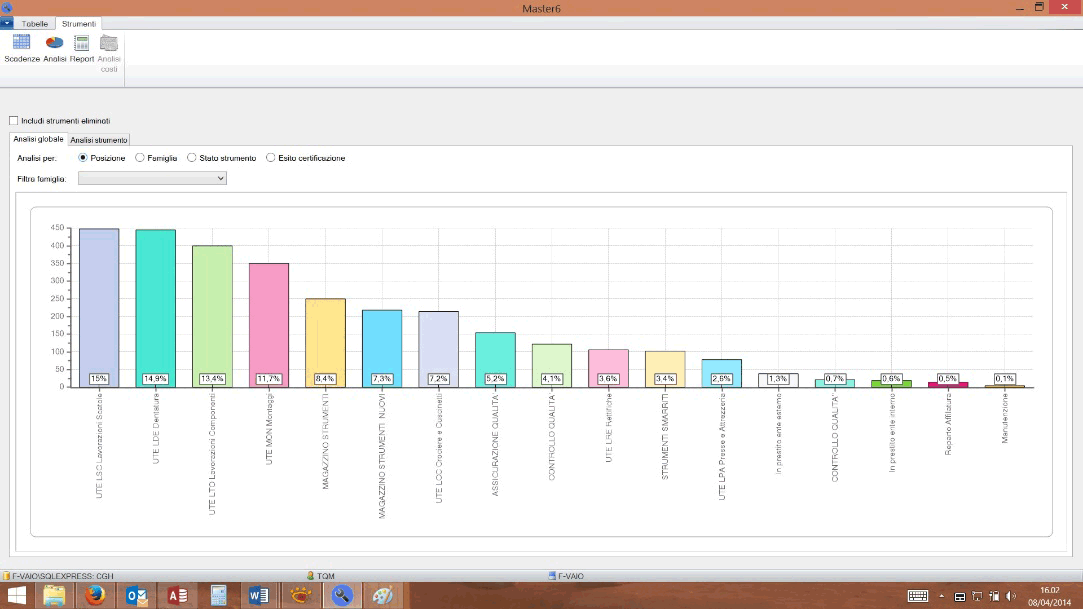
Analisi globale e per famiglia della posizione strumento

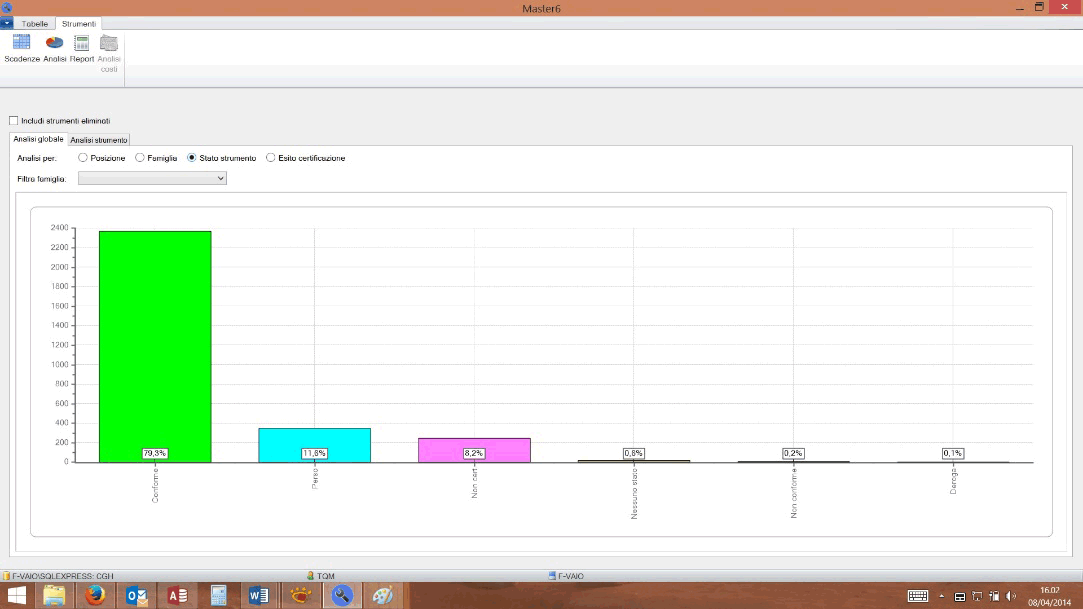
Analisi globale e/o per famiglia per stato strumento


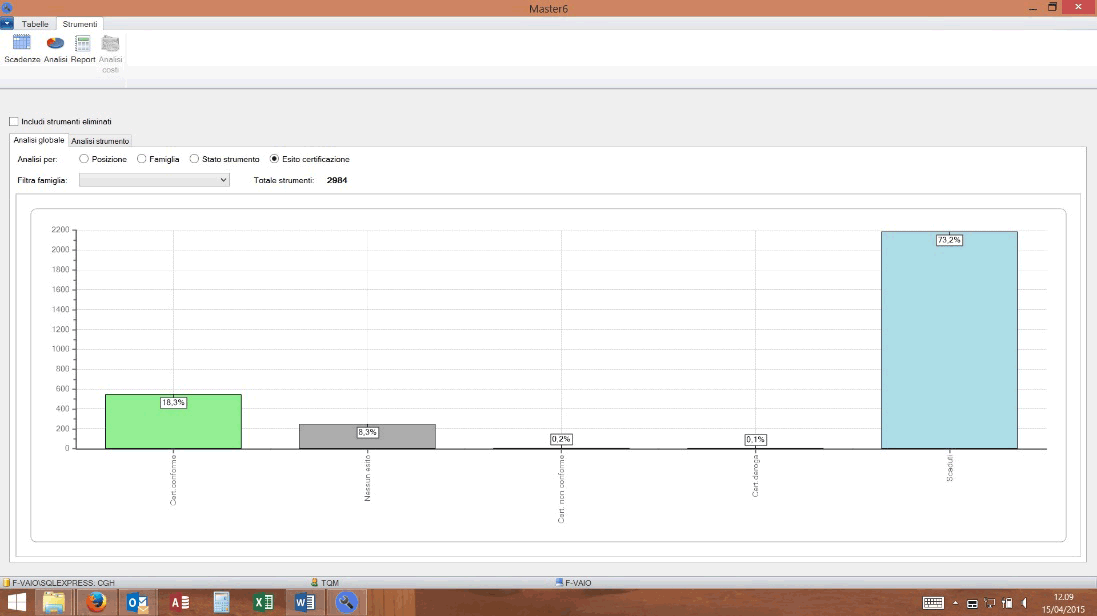
Analisi globale e/o per famiglia per esito certificazione

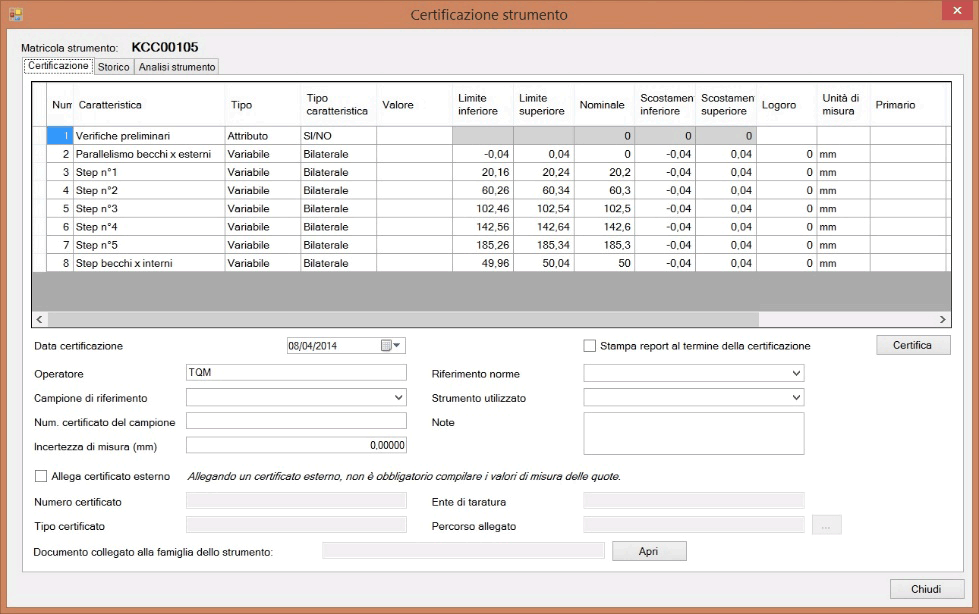
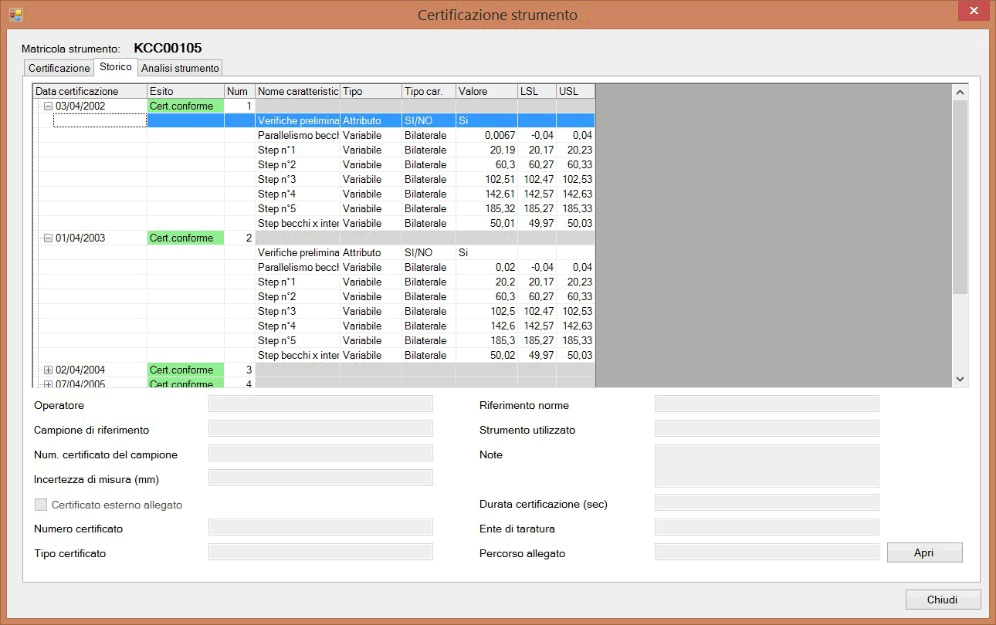
The calibration of the instrument is made easier by a guided procedure. It is possible to manage the external calibrations with the possibility to save the certificates of the external laboratories.


Scheda di cerificazione

Storico certificazioni per strumento, con disponibilità di tutti i dati registrati

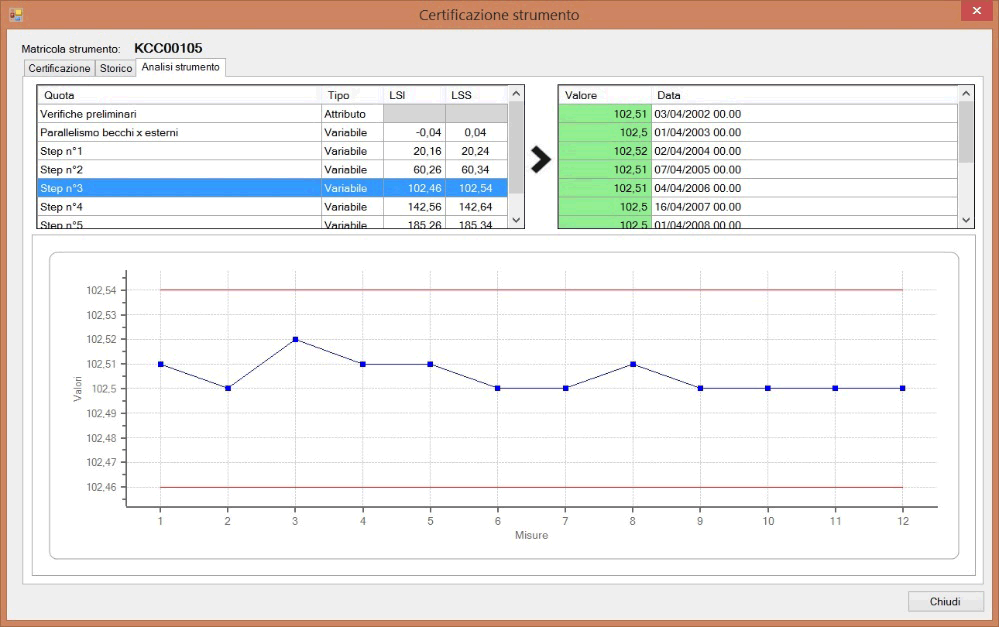
Analisi storica dell’andamento di ciascuna quota nelle varie certificazioni


Statistical analysis is fundamental for the exact interpretation to give to measuring data; the same data analysed with different criteria can return different results: important decisions may depend on these results. For this reason it’s necessary that the analysis is performed correctly.

ITASTAT 6 Analysis is the software module for the Statistical Analysis which integrates 20 years of experience of TQM Itaca Technology with the competence of the Politecnico of Milan (Mathematics department - IMATI - CNR) directly involved in the development of algorithms for the theoretical distribution model research which best represents the real data.The complete Ford tests compliance is guaranteed. Itastat 6 Analysis, besides Normal, manages Non-Normal distributions: Log-Normal, Extended Limits Normal, Semi-Normal, Folded Normal, Weibull, Rayleigh, Johnson, Mixed.

Available modules:
Itastat 6 Analysis SPC: Machine Capability, Preliminary Analysis, Process Analysis, 100% control.
Itastat 6 Analysis MSA: measurement system analysis module.
Report Editor: To modify the existing reports and/or create new reports.
Itaselect: Powerful producer of queries, it allows to select the data contained in a database up to auxiliary data level, in order to make comparisons between batches, temporal comparisons, etc...

Main Features:

Total configurability of the evaluation method.

Calculation of capability indexes with percentiles method. 

Itastat 6 analisi 2

Itastat 6 analisi 3

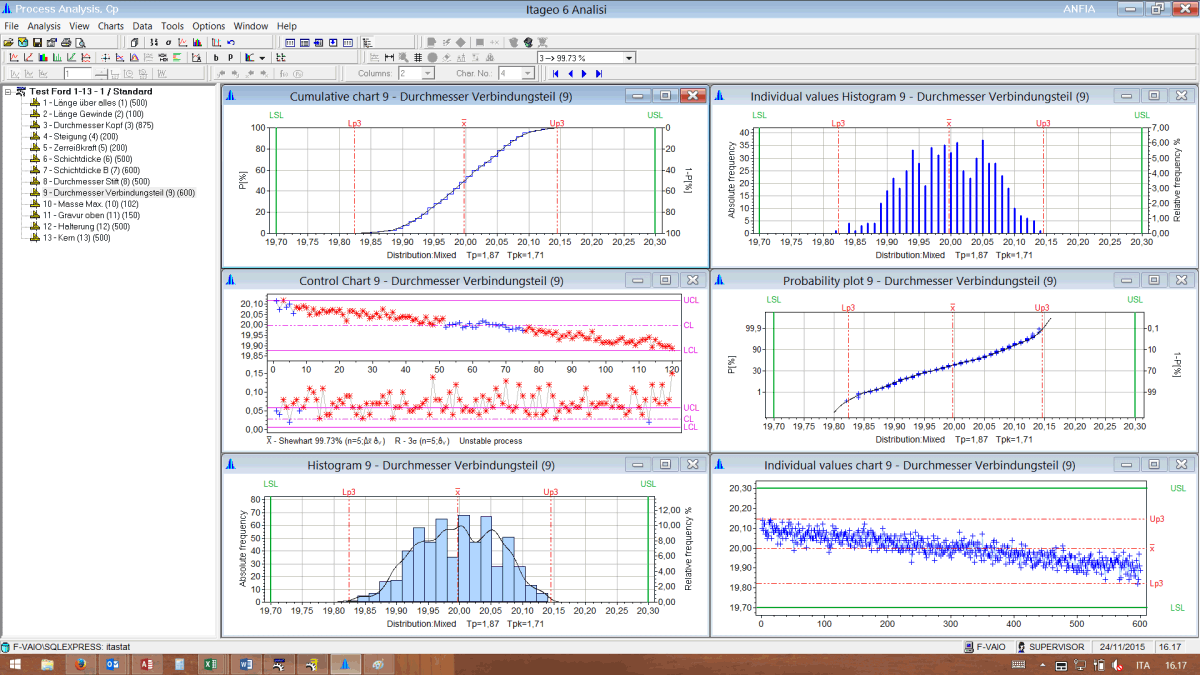
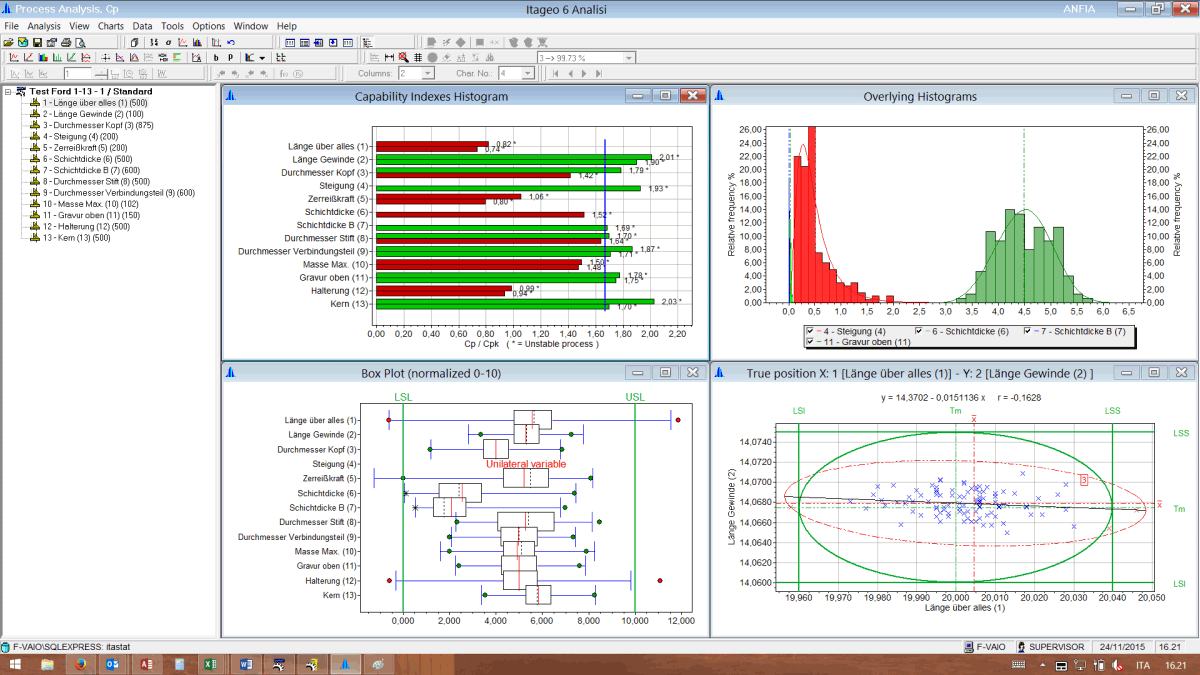
Management of Non-Normal distributions. Effective graphical representations: histograms, GPNs, control charts, tables.


Itastat 6 analisi 4

Itastat 6 analisi 5
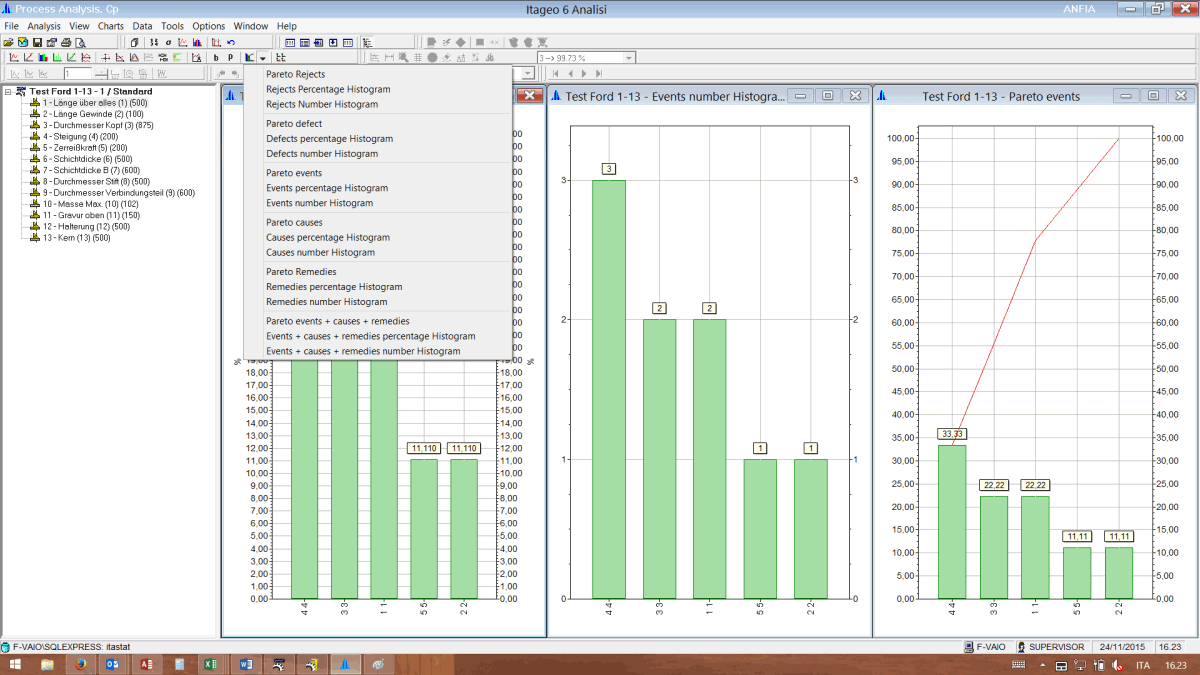
Multi-characteristic charts: Linear correlation, Box Plot, Capability indexes histograms. Pareto Analysis (Rejects, Defects, Events, Causes, Remedies). 

Advance selection on data stored in the database. 

Native utilization of relational database in MS-Access and MS-SQL format;

Data import/export from dfq, dfd/dfx and MS-Excel formats.


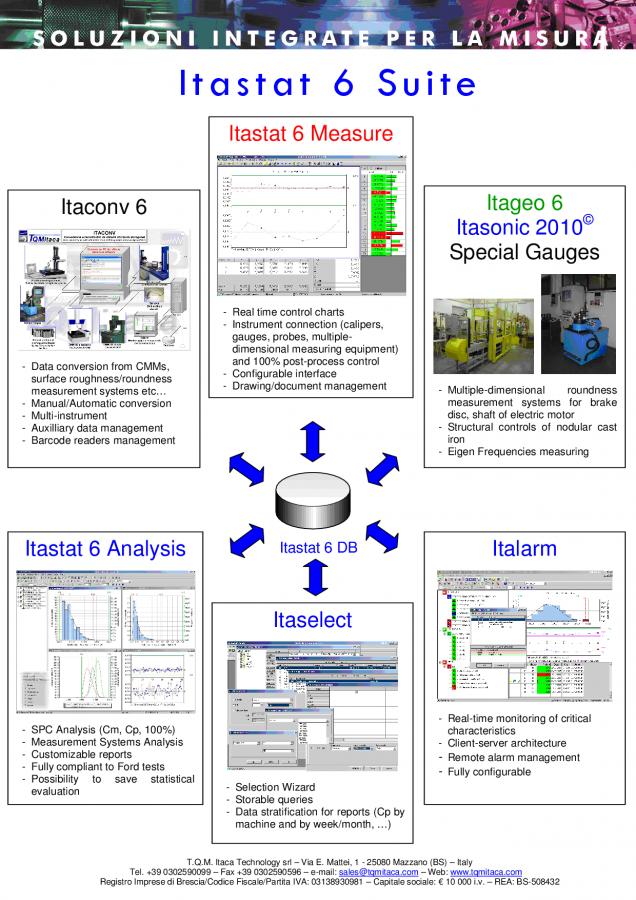
Itastat 6 Analysis is an integral part of the Itastat 6 Suite, the TQM Itaca Technology integrated system for the acquisition, the saving, the statistical analysis and the management of all measuring data from any “standard” measuring instruments, updated and maintenanced.

suite Itastat


The monitoring and supervision of production processes are becoming requirements perceived by an increasing number of companies. TQM Itaca Technology has developed the ITALARM software application for the monitoring in real time of the statistical alarms of all the measuring stations existing in the company.


Based on a Server-Client architecture, Italarm monitors all the data written into an Itastat MS-SQL database by an Italarm Server. On the server it is possible to set all the critical characteristics which you want to keep under control with the immediate display of the batches containing the characteristics in alarm. Using the Italarm clients it's possible the remote monitoring allowing efficient reactions to the alarms.


Italarm is useful both as a summary for the different supervisors and as a system of alarms reporting and consultation towards the production lines.

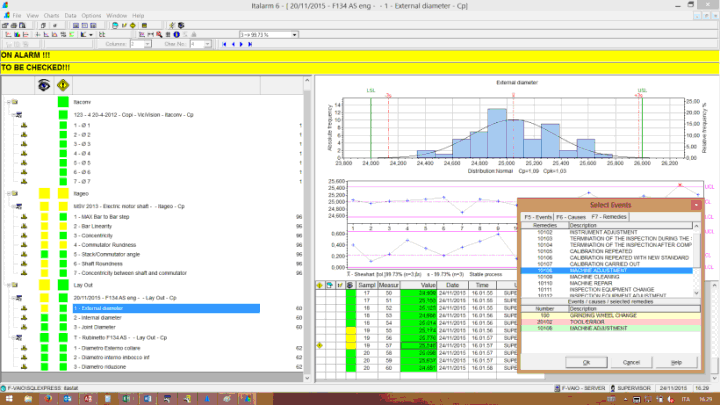
In the example screenshot three monitored emplacements are displayed on the left side of the screen and two of them are in alarm state.


Italarm

  • Gear inspection system. Three open batches: the first show san important alarm (Blue), the second is ok (Green), the third shows a critical alarm (Red).
  • Profilometer. One open batch: Ok (Green).
  • Line 1. One open batch with critical alarm (Red) on characteristic 5 – Oscillation of F compared to A.

In the right side there are three charts: Histogram, Control Chart and Data Table of characteristic 5 – Oscillation of F compared to A, with an open window showing the cause of the alarm and the remarks/events posted by the operator.

The statistical alarm information can be announced on the shopfloor in different ways:

  • Visual or acoustic signal
  • Italarm client on machine, set to display the batch in production on the specific station.

The criticality of statistical alarms can be set according to three levels: critical, important or secondary, highlighting each level with specific colors.

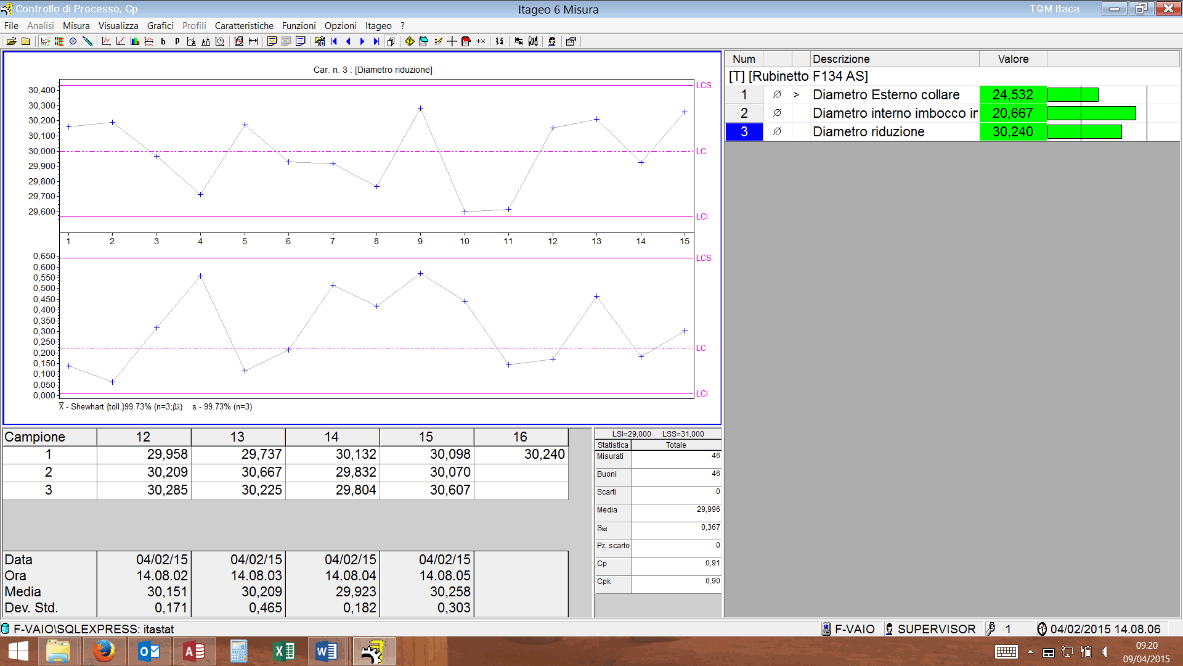
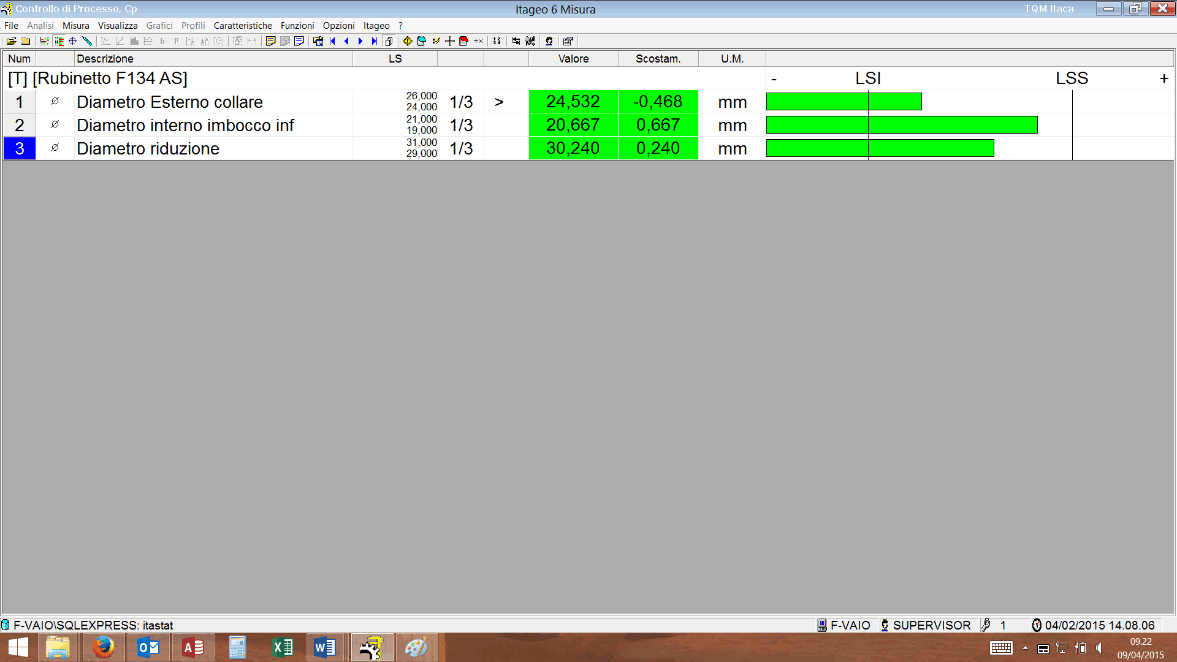
Itastat 6 Measure is the SPC software module for the acquisition of the measures from keyboard or directly from manual instruments used in a workshop: provided with simple and complete operator interface, it allows to increase the measuring with useful auxiliary data. It’s possible to make compulsory the registration of Operator’s Notes or of pre-configured Events, which can be linked to Causes and Remedies in correspondence of values out of tolerance or in case of statistical alarms. It’s possible to set the request of sampling at predefined intervals, the phases of sampling with different frequencies are managed in the same control plan. Itastat 6 Measure can be managed using a programmable operator keyboard, and it’s possible to use a pedal for the confirmation of the measure. It writes the data directly in the SQL database of Itastat 6, which can be centralized on a server. Itastat 6 Measure manages possible network failures automatically inverting the acquisition on a local database.


Itastat 6 Measure can be integrated with 2 optional modules which allow the management of documents and images:

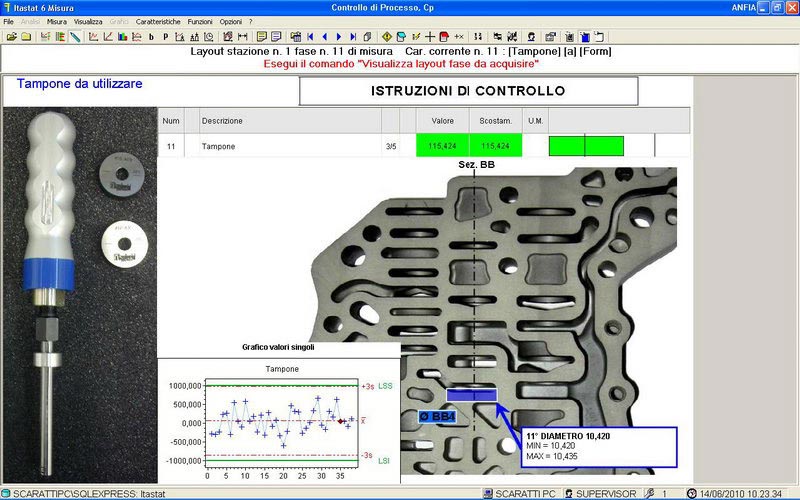
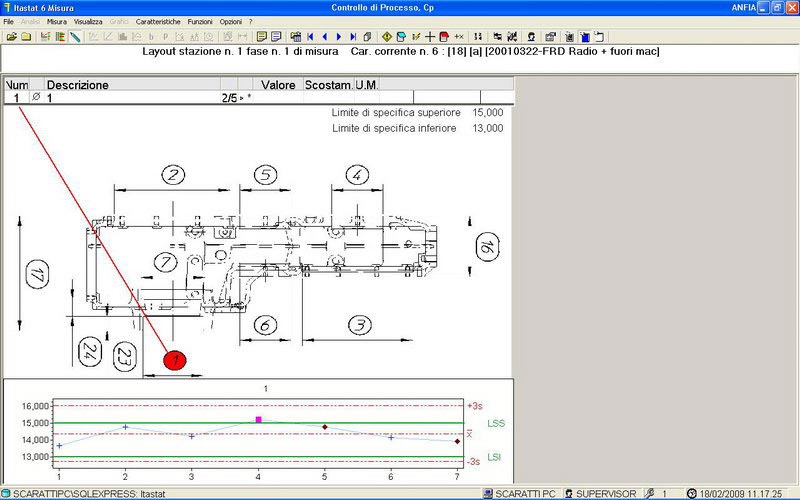
  1. Lay Out Designer.  It’s the module which allows the total configuration of the operator interface. So, it’s possible to display drawings, pictures etc… related to the pieces to be measured or to the operations to do, etc.. for each measuring phase of each control plan.
  2. Doc Viewer. It allows to univocally link documents (max 8) of different formats (pdf, dwg, dxf, doc, xls, txt, bmp, tiff, jpg, png, mpeg, avi, etc.) with each control plan: the linked documents (technical drawings, control instructions, production instruction, etc…)   are recalled by the operator keyboard. It needs the network connection of the measuring stations.


image001

image003

Example of operator interface with control charts for characteristic, and coloured bars to exactly display each executed measuring. Example of operator interface without graphs but with extended bars.


image005

image007

Example of operator interface with option Lay Out Designer, which allows to personalize the display for each phase of the control cycle.  


FaLang translation system by Faboba
Save
Cookies user preferences
We use cookies to ensure you to get the best experience on our website. If you decline the use of cookies, this website may not function as expected.
Accept all
Decline all
Read more
Analytics
Tools used to analyze the data to measure the effectiveness of a website and to understand how it works.
Google Analytics
Accept
Decline